
The official networks: EPA RadNet and UK sources
In the United States, the main public map comes from the EPA's RadNet program (epa.gov/radnet). According to the EPA, RadNet runs 140 air monitoring stations across all 50 states. They measure gamma radiation in near real time, and the results appear on a public page, the RadNet Dashboard. The EPA describes these readings as the normal environmental background. Pick the station closest to you and see how much its values move from day to day.
In the United Kingdom, the UK Health Security Agency (UKHSA) publishes context rather than a live street-level map. Its page Ionising radiation: dose comparisons puts average UK exposure at about 2.6 mSv per year and a transatlantic flight at 0.08 mSv. For radon, UKHSA runs ukradon.org, whose maps of radon Affected Areas show where to test. These figures are context, not a threshold.
What a station measures versus what your pocket counter shows
A RadNet station has its own detector, height, calibration and units. A pocket counter with a glass Geiger-Muller tube counts pulses: a particle that ionizes a few gas molecules in the tube sets off an electron avalanche, and the device turns each pulse into a click (HyperPhysics, Georgia State University). The count rate in CPM depends on that particular tube, and the µSv/h figure is the counter's own conversion of those counts. So the station value and your screen will not match number for number.
The working rule is simple: compare trends, not numbers. If your averaged background at home stays steady for weeks and the nearest station also stays flat, the two agree in the way that matters. If only one moves, look for a local cause first, such as a new object on the shelf. CPM also cannot be compared between two different counters, even two sitting side by side.
- Detects: beta, gamma and X-rays through a glass tube (J321 type as listed by the supplier).
- Does not detect: alpha particles, EMF, Wi-Fi or 5G.
- Is not: a radon test, a food or water test, a calibrated measuring instrument or protective equipment.
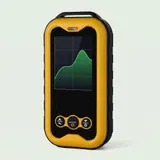
- Shows: indicative dose rate in µSv/h, count rate in CPM or CPS, cumulative dose and a trend graph.
| Source | What it shows | How to use it next to your counter |
|---|---|---|
| EPA RadNet Dashboard (epa.gov/radnet) | Near-real-time gamma from 140 air stations in 50 states | Watch the nearest station's trend next to your own log; do not match numbers |
| EPA, Radiation Sources and Doses | Where background comes from; US average of 6.2 mSv per year (NCRP) | Context for why readings differ by place and altitude |
| EPA, Cosmic Radiation | Cosmic share of about 5% of the US annual dose, higher at altitude | Expect a different baseline at higher elevation and log it on site |
| UKHSA, Ionising radiation: dose comparisons | UK average of about 2.6 mSv per year; 0.08 mSv for a transatlantic flight | Context for UK readers, never a threshold |
| UKHSA UK Radon (ukradon.org) | Radon Affected Areas maps and radon measurement packs | Decide where to test radon with a kit; your counter cannot measure it |
| Your own log | Your averaged dose rate and CPM at one spot over weeks | The only baseline your counter can be compared with directly |
How to log your own background
A useful comparison starts with your own baseline. Pick one spot, such as a shelf or a window sill, and always measure there at the same height. Switch the counter on, give the reading time to settle, then average over several minutes instead of trusting a single glance, because short readings jump around. Write down the average dose rate, the CPM (the raw count from the tube), the date, the time, the weather and whether you were indoors. The dose rate trend graph on the 2.4-inch screen helps you see whether the value is drifting or just flickering. After a few weeks you have a real baseline for that place.
A notebook or a spreadsheet is enough. The counter keeps its cumulative dose, trend curves and alarm settings after power off, but your notes on conditions are what make later readings meaningful. The manufacturer also describes a PC data download over USB-C with its own software, which the shop does not supply. For long logs, plan charging: the manufacturer states 30 days or more in long-life mode, while an independent test reported about 5 days in normal use.
Why readings vary from place to place
Background radiation is not the same everywhere, and the EPA says so directly: it comes mostly from minerals in the ground, from water and from cosmic radiation, and it varies from one location to another (EPA, Radiation Sources and Doses). Building materials made from stone or earth can carry the same natural minerals, so indoor and outdoor readings can differ. The EPA's page on granite countertops notes that granite can contain traces of natural radioactive elements, that the amount varies from stone to stone, and that radiation drops quickly with distance.
Altitude matters too. According to the EPA, cosmic radiation rises the higher you are in the atmosphere, so Denver receives more of it than Miami, and cosmic radiation makes up about 5% of the average annual dose in the United States. The EPA cites an average annual dose of 6.2 mSv (620 mrem) per person in the US (NCRP), an average that explains variation, not a line that makes any reading acceptable.
When your reading looks unusual
Most surprises have an ordinary cause: a different spot or an object nearby. According to the EPA, some old objects can make a Geiger counter react when it is held close: uranium glass (yellow-green, glowing green under UV light), some orange-red dinnerware glazed with uranium before 1973 and luminous radium dials. Keep such objects intact, never take apart a radium dial, do not use them for food or drink, wash your hands after handling, and ask your local authority if one breaks. On beta sources the µSv/h figure also runs high because the tube has no beta shield, so read the CPM.
If a reading is unusually high or stays high, move away from the source and do not handle the object. In the US, contact your state radiation control program or the EPA; in the UK, contact UKHSA or your local authority. In an emergency, call 911 (US) or 999 (UK). The two adjustable alarms can flag a threshold you set, but the readings are indicative and the number on the screen is not a verdict on an object.
What radiation maps cannot tell you
A map of air stations shows background gamma over a wide area. It says nothing about the object on your desk or the air in your basement. Radon is the clearest example: it rises from the ground, and neither a station map nor a Geiger counter measures its concentration. The EPA says radon is measured with a radon test kit, available from hardware stores, online or through your state radon program. In the UK, ukradon.org offers a radon measurement pack, and its Affected Areas maps show where to test.
A calm station nearby says nothing about radon in one particular house, which is why the EPA and UKHSA point to a test kit, not a map. Use the map as a backdrop for your region and your log for your shelf. If you want a counter for this kind of logging, Geiger Counter Shop sells one pocket model with a glass GM tube (J321 type as listed by the supplier), a 2.4-inch color screen, µSv/h and CPM, a trend graph, alarms and a USB-C battery, shipped free from stock in the US or the UK.
Frequently asked questions
Can I compare my CPM with a RadNet station?
Not directly. CPM depends on the tube inside one particular counter, while the station uses a different detector, height and units. Even two pocket counters give different CPM at the same spot. What you can compare is direction: if your averaged background and the nearest station both stay flat for weeks, your log is consistent. For reference, one independent test recorded about 20 CPM at background with this type of glass tube.
Why is my reading higher at altitude?
Cosmic radiation increases the higher you are in the atmosphere, which is why the EPA notes that Denver receives more of it than Miami. The ground and rocks around you also change when you travel, so a mountain cabin can show a different baseline from home. Log a few averaged readings on site before drawing any conclusion, and treat the result as indicative.
Where can I see UK radiation data?
Start with UKHSA's pages on gov.uk, such as Ionising radiation: dose comparisons, which gives average UK exposure of about 2.6 mSv per year and an average annual radon dose of 1.3 mSv. For radon, ukradon.org publishes maps of radon Affected Areas and offers a radon measurement pack. A Geiger counter cannot stand in for that pack.
Sources
- U.S. EPA, RadNet
- U.S. EPA, Radiation Sources and Doses
- U.S. EPA, Cosmic Radiation
- UK Health Security Agency (UKHSA), Ionising radiation: dose comparisons
- UKHSA, UK Radon
Our guides are based on the supplier's listings and public documentation. We have not tested the counter ourselves.


